
Introducing the data warehouse and business intelligence industry to dimensional modeling in its current form in 1996, the Kimball Group has since published numerous articles and tips that cover dimensional modeling best practices, establishing a worldwide following. Data warehouse experts jokingly say that the world is divided into two types of people: those who build the Kimball data warehouse and those who don’t. This article will focus on the basics of dimensional modeling to help you understand data warehousing concepts better.
Data can be modeled in a variety of different ways, and dimensional modeling one of them. The primary reason dimensional modeling is its ability to allow data to be stored in a way that is optimized for information retrieval once it has been stored in a database. When building a data warehouse for business intelligence, dimensional modeling allows:
- Stored data to be easily understood when viewed as a reporting schema where relationships between tables are clearly labeled
- Faster querying across your enterprise systems; lesser joins are needed to display query results because of the denormalized structure
- Flexibility to change or extend data models to reshape them as business requirements change, giving way to an agile data warehousing approach
Let’s start with listing the basic components of a dimensional model, later tying them all together to get a complete picture:
Dimension Table
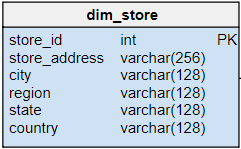
Dimension tables store the descriptive details of each business process; the what, who, where, and when. In the store dimension here, the dimension table holds the address and other details related to the store’s location. Each of these ‘attributes’ represents a column in the database.
Fact Table

A fact table stores transaction or event data in a numeric format. In the example above, the fact table holds values for ‘price’ and ‘quantity’. These are called ‘measures’. The rest of the entries you see in this fact table are ‘foreign keys’ of dimensions that are dependent on this fact table. The dimensions, therefore, associated with our fact tables are product, time, store, employee, and sales.
Primary and Foreign Keys
Each dimension has a primary key, which is stored in the dimension table as a separate column. To reference these primary keys and therefore associated records in a dimension table, foreign keys are used, which are stored in a separate column. As seen in the fact table diagram above, foreign keys that reference primary keys to each of the associated dimensions are contained.
Tying the Components Together
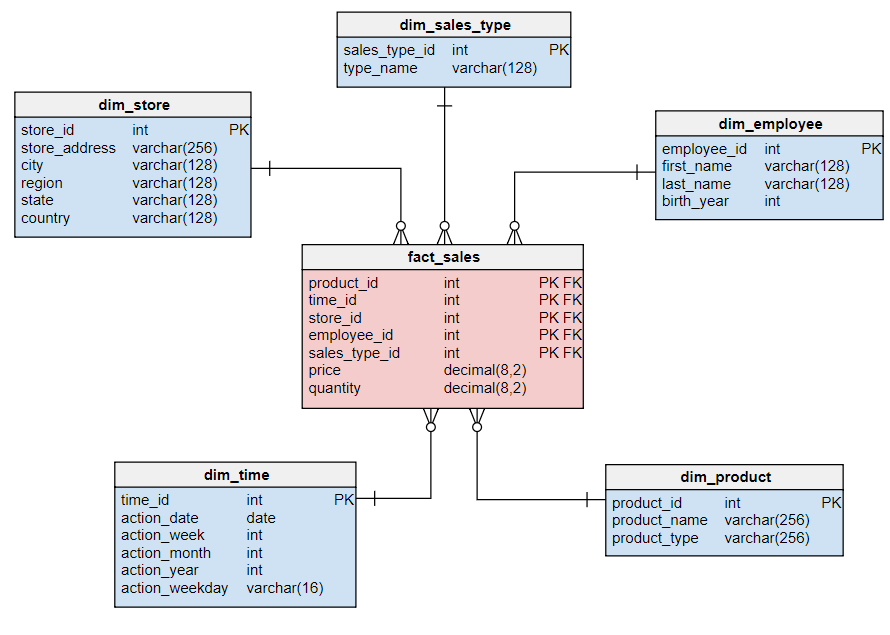
When we bring dimensions, facts, and primary and foreign keys together, we get a dimensional modeling schema:
This diagram illustrates a star schema, the most popular dimensional modeling schema used in data warehousing. In a star schema, there can be one or more fact tables, and each fact table is associated with multiple dimensions. The resultant shape resembles a star, thus the name ‘star schema’. This schema is the simplest form of a dimensional model.
So how is a dimension model designed? Let’s take a look.
Process Overview: Building a Dimensional Model
Building a dimensional model requires a thorough understanding of business processes and a deliberative approach to database design.
Step 1: Identify a business process
The first step is to gather requirements and identify a business process to be modeled. You will need to hold discussions with business users to understand their reporting requirements, how they perceive the business process, what data metrics would they want to use in their reports, etc. The second part of this stage is to consult with system experts who work with data sources for your business processes. Profile data in the source databases so you can determine how to model your dimensions.
Step 2: Establish granularity
This refers to the level of detail you want in your reports, allowing you to determine the facts and dimensions for your dimensional model. The grain in the star schema diagram shown above could, for instance, be “daily revenue from a specific product by a specific employee from a specific store”. By describing granularity in a sentence like this, you can figure out needed facts and dimensions.
Step 3: Identify dimensions
From the granularity example above, the level of detail you require will necessitate at least time, sales, product, store, and employee dimensions. Think about how you would potentially want to use each dimension and then design attributes. For instance, the time dimension could have daily, weekly, and monthly attributes.
Step 4: Identify Facts
Once dimensions are identified, you can move to the fact table. The fact table will contain foreign keys to each of the dimensions. Now identify the facts that will populate fact table records. In our ongoing example, facts could be price and quantity.
What Tools to Use to Create a Dimensional Model?
Once you have the data warehouse design down theoretically, you will need to actually create the model on a data warehousing platform. This may require using a modeling tool like Erwin, then an ETL tool to load your data into the data warehouse, and a host of other tools to go all the way to generating reports from your dimensional models. A smarter way is to use a data warehouse automation platform where you can go from conceptualizing models all the way to getting business intelligence from them.


One comment